- Overview: The Different Modes
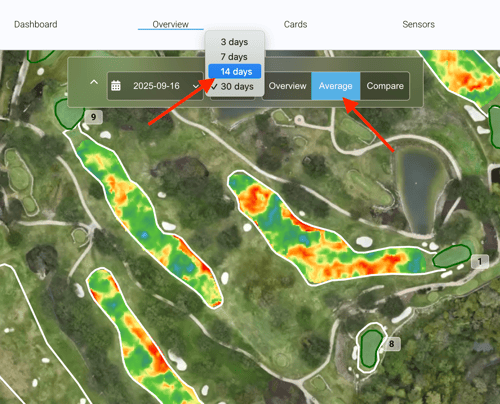
Switch between daily, average, and compare view.
In Overview mode, the map displays your fairways with a smooth gradient of colors, showing where turf is too dry, too wet, or within your ideal target zone. It’s the most straightforward way to see how your course looks on any given day.
Average mode lets you look at conditions over time. After selecting a starting date, you can choose a time window of 3, 7, 14, or 30 days. The map then shows the average soil moisture over that period, giving you a sense of longer-term conditions rather than a single snapshot.

Compare mode allows you to directly contrast two scan dates. You select the two days you want to compare, and then use a vertical line that can be dragged across the screen to reveal how conditions changed between the two dates. This mode is especially helpful for seeing the effect of irrigation adjustments, rain events, or seasonal transitions.