Sprinkler View in the turfRad Portal lets you visualize how each sprinkler contributes to overall moisture distribution. By linking soil moisture data directly to sprinkler locations, it reveals not just how much water is being applied, but how evenly it’s reaching the turf.
1. Moisture View – Spot Wet and Dry Patterns Instantly
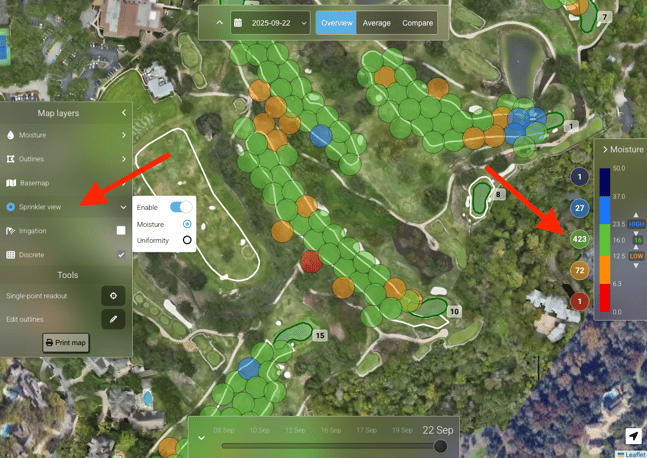
When you enable Sprinkler View in the Map Layers panel and select Moisture, each sprinkler head is shown as a circle representing its irrigation radius (typically 30 ft). The color of the circle reflects the average root-zone moisture within that area — from red (very dry) to dark blue (very wet).
Use this view to:
- Identify underwatered zones (red/orange) or oversaturated areas (blue/dark blue).
- Cross-check recurring dry rings around heads — a common sign of pressure loss or nozzle mismatch.
- Detect areas that consistently remain wetter than surrounding turf — for example, low-lying zones or spots with poor drainage.
Tip: If certain heads always appear wetter or drier than their neighbors, review pressure settings or nozzle uniformity.
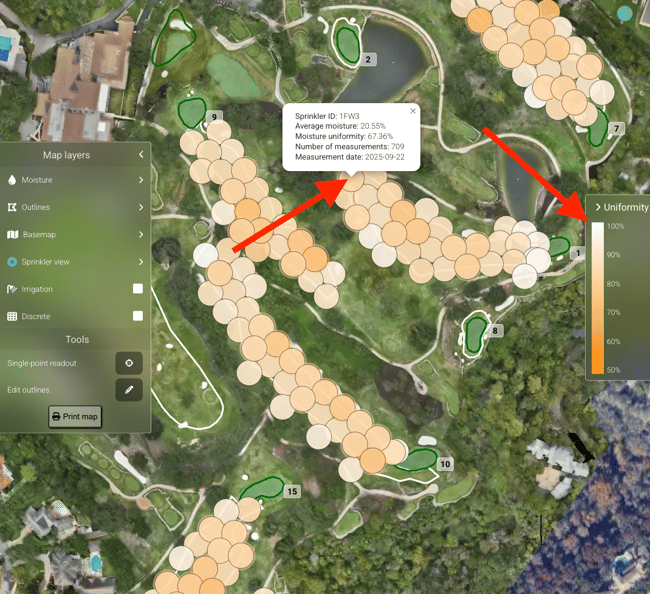
2. Uniformity View – Evaluate Evenness of Distribution
Switching to Uniformity View changes the map from absolute moisture to how evenly water is distributed around each sprinkler.
This is valuable because a head might deliver the right amount of water overall, but still show uneven coverage that leads to stressed turf.
You can interpret this in two display modes:
1. Gradient View: Smooth shading from 50–100% uniformity helps you spot gradual performance differences across the course.2. Discrete View: Divides heads into three clear performance bands:
- 90–100% → near-ideal
- 70–90% → moderate variation
- 50–70% → needs attention
Look for clusters of heads with reduced uniformity — these often point to pressure inconsistencies, nozzle wear, or blockages that aren’t visible from the surface.
Tip: If uniformity is low but moisture still appears high, it could indicate overcompensation — where excess watering is masking inefficiencies.
3. Using the Moisture Threshold Bar
On the right-hand side of the Portal, the Moisture Threshold Bar summarizes how many sprinklers fall into each category (Very Dry, Dry, Target, Wet, Very Wet).
This gives you an instant snapshot of course-wide conditions:
- A healthy balance typically shows a concentration around “Target.”
- Too many heads in “Wet” or “Dry” bands may indicate scheduling or pressure issues.
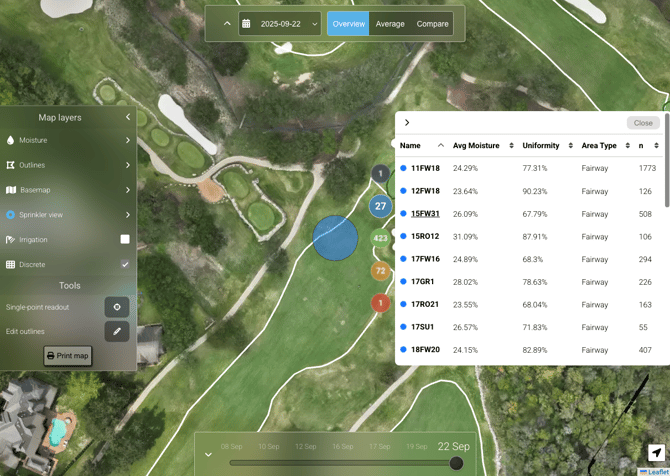
Clicking on any category opens a list of affected heads with detailed data, helping you decide where to act first - see screenshot below:
Watch It in Action
The video below walks through how to read Sprinkler View in the turfRad Portal — switching between Moisture and Uniformity View, using the Moisture Threshold Bar, and identifying patterns across your course.