Card View helps you understand how soil moisture changes over time — whether across a few days or several weeks. By showing side-by-side moisture maps for a selected time span, it highlights subtle patterns that can reveal underlying issues before they appear on the surface.
Unlike a single scan, Card View lets you see the story of your turf unfold. You can watch moisture shift after rainfall, identify areas that remain persistently wet or dry, and confirm whether irrigation adjustments are having the intended effect.
What You Can Learn from Card View
Here are some examples of how you can interpret what you see:
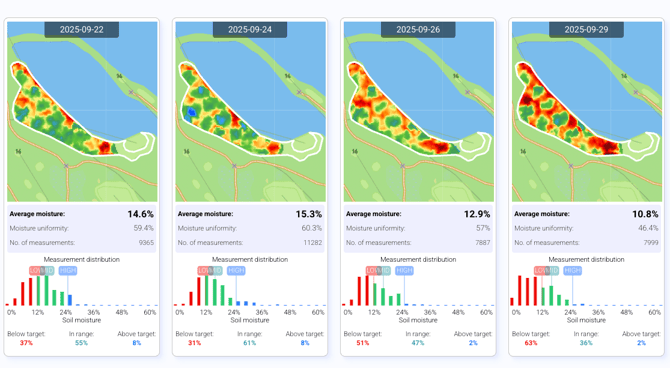
1. Persistent Wet Areas
If a section of the course stays consistently blue across several scans, even when surrounding areas return to target range, it may indicate overwatering or a drainage issue. Card View makes these patterns clear, helping you:
- Detect areas that remain wetter than expected
- Adjust runtimes or inspect drainage before stress develops
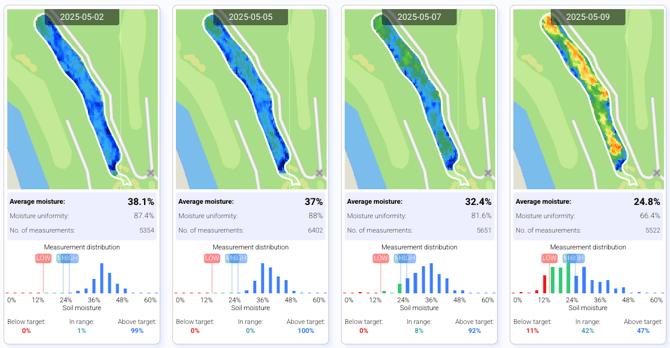
2. Drying Trend After Rain
Card View helps track how quickly the course dries after rainfall. As soil moisture decreases, you’ll see gradual color shifts from blue to green to orange. This helps you:
- Understand which holes retain moisture longer
- Delay irrigation until moisture truly drops below target levels
- Plan hand-watering more efficiently
Tip: Comparing several post-rain scans reveals which zones dry faster or stay wetter, guiding precise irrigation timing.
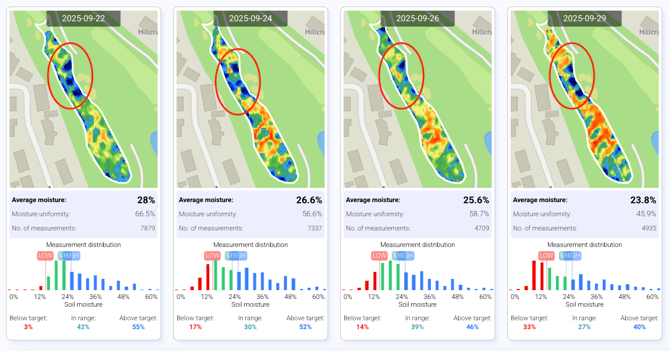
3. Pressure or Distribution Issues
Ring-shaped dry zones between sprinklers often signal a pressure or nozzle issue. In Card View, these circular patterns persist over time, confirming that the problem isn’t random. By combining this with Sprinkler View, you can:
- Locate the specific sprinkler heads causing uneven distribution
- Verify whether the issue is localized or system-wide
- Restore uniformity before visible turf stress appears
Card View is a powerful tool in the turfRad Portal for diagnosing trends and confirming results. Whether you’re spotting irrigation inefficiencies, tracking moisture recovery, or validating adjustments, it gives you confidence that your irrigation strategy is working — supported by real, root-zone data.