Understanding where your course is consistently too wet or too dry is one of the fastest ways to improve irrigation efficiency. The turfRad Portal gives you multiple ways to spot these areas and trace them back to their cause — whether it’s a sprinkler head, slope, or system setting.
1. Use Average Mode to Identify Persistent Patterns
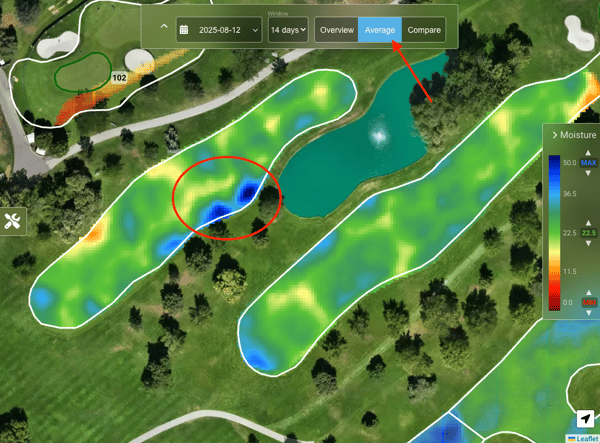
In the Overview tab, switch to Average Mode and select a time range — 3, 7, 14, or 30 days.
This smooths out daily variations, helping you see recurring wet or dry zones rather than one-off events (for example, from rain or irrigation adjustments).
What to look for:
- Consistently blue areas: May indicate over-watering or poor drainage.
- Consistently red/orange areas: Show under-watering, blocked nozzles, or low pressure.
- Sharp transitions: Can point to head spacing issues or slope influence.
Example:
“This area remained wet across 14 days of scans, confirming it’s not just a temporary fluctuation.”
2. Pinpoint Problem Heads with Sprinkler View (Moisture)
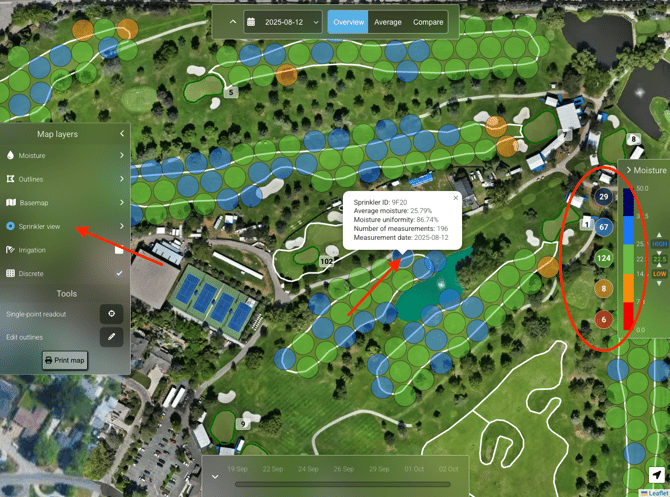
Enable Sprinkler View → Moisture to see how each sprinkler’s surrounding radius performs.
Each circle represents the average moisture within that head’s radius (default 30 ft).
-
Red/Orange circles: Areas that stay dry even when nearby zones are hydrated — often a nozzle, valve, or pressure issue.
-
Dark blue circles: Over-watering zones that might indicate double coverage or faulty scheduling.
Click any color range in the Moisture Threshold Bar to list all sprinklers in that condition. From there, you can go directly to a head on the map to investigate.
3. Audit Distribution with Uniformity View
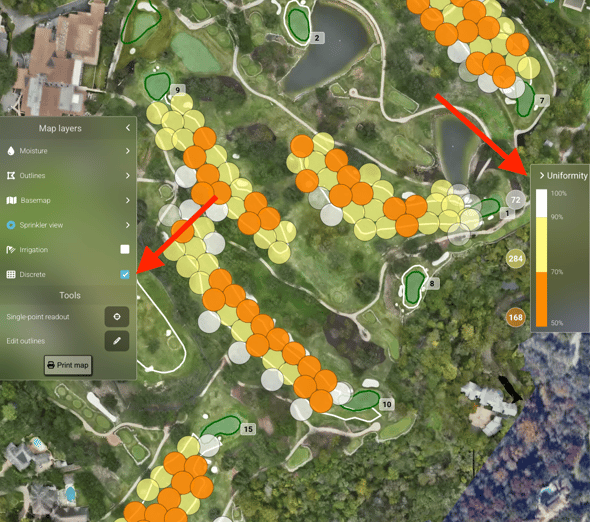
Switch from Moisture to Uniformity View to see how evenly each sprinkler distributes water within its radius.
1. Gradient Mode: Shows subtle differences — lighter tones = higher uniformity.
2. Discrete Mode: Breaks results into clear performance bands:
- 90–100% = near-ideal
- 70–90% = moderate deviation
- 50–70% = needs attention
Use this view to identify which sprinklers cause variability across the fairway and plan targeted maintenance or nozzle checks.
By combining Average Mode, Sprinkler View, and Uniformity View, you can spot irrigation imbalances early and act before they impact playability or turf health.
This workflow effectively turns your turfRad Portal into an ongoing irrigation audit tool — showing exactly where water distribution can be improved for more uniform, efficient, and sustainable performance.