![turfrad_logo_outlines (1)-1.svg]](https://support.turfrad.com/hubfs/turfrad_logo_outlines%20(1)-1.svg)
What happens between a turfRad sensor taking a measurement while driving over the turf and a map of volumetric water content appearing in the Portal?
Quite a lot - but the underlying physics is familiar.
If you've used a handheld moisture meter before, you may assume the probe is directly measuring the water in soil while turfRad is somehow estimating it from a distance. In reality, both approaches use the dielectric properties of soil to determine volumetric water content (VWC). They simply reach that information in different ways.
What the Sensor Hears
Everything warmer than absolute zero emits electromagnetic energy, including at microwave frequencies. turfRad is a passive radiometer tuned to approximately 1.4 GHz (L-band). It measures the natural microwave energy emitted continuously by the soil and turf surface.
Water has a strong effect on that signal. Wet soil emits less L-band microwave energy than dry soil, so to the radiometer, wetter ground effectively looks quieter. At this frequency, the useful signal comes from roughly the upper 7-10 cm (about 3-4 inches) of the soil profile - right in the active turf root zone - and can be measured through the grass canopy.
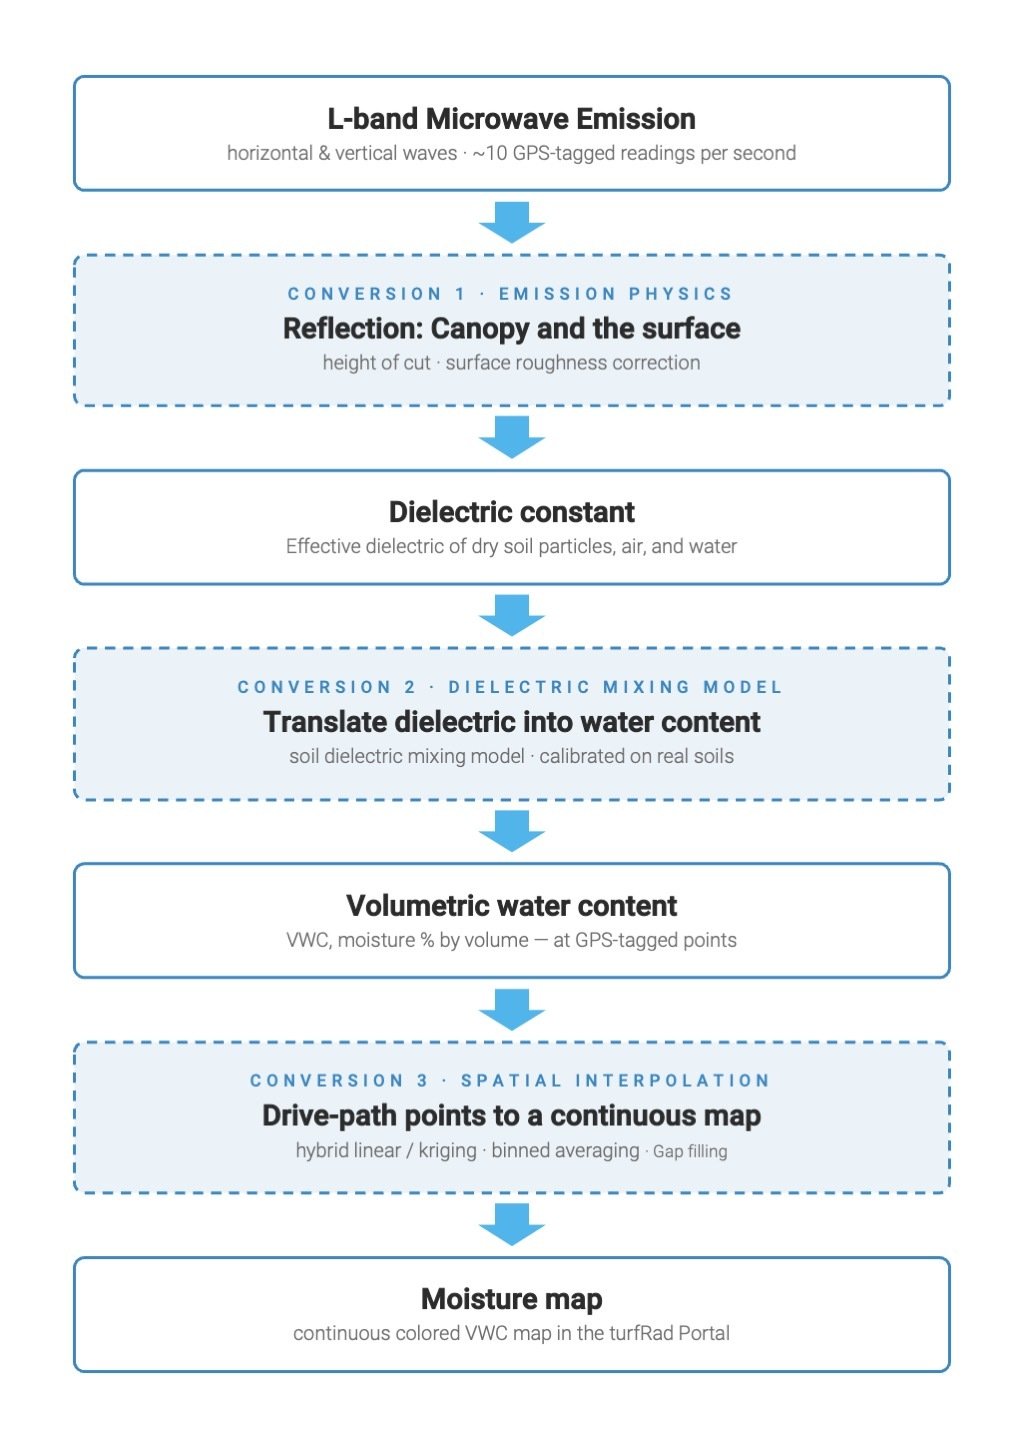
As you drive, turfRad records this natural emission as brightness temperature in Kelvin, GPS-tagged at roughly ten readings per second. But brightness temperature is not yet a moisture value. The data still has to travel through a few steps before it becomes the VWC map you see in the Portal.
And yes - it is safe to stand next to the sensor.
turfRad is passive. It does not transmit microwave energy into the soil or toward the person standing next to it. It simply listens to the faint microwave energy the Earth naturally emits. It is listening, not shouting.
The turfRad Measurement Pipeline
Account for the Canopy and Surface
The antenna does not hear bare soil alone. The turf canopy absorbs part of the soil emission and contributes a small signal of its own. This is why we boundary out the fairways separately from the greens or areas with varying height of cut. The soil surface also reflects and emits energy differently depending on its texture: sand, clay, loam, this is handled in our Tuning & Portal Meeting with the Customer Success team.
The turfRad pipeline accounts for these effects and runs the emission physics in reverse to determine the moisture content that best fits microwave emmision measured by the sensor.
Translate Dielectric Constant Into Water Content
Everything warmer than absolute zero constantly gives off weak electromagnetic signal, including at microwave frequencies. Soil, simply because it has a temperature, naturally emits a small amount of microwave energy at 1.4 GHz.
- Air: dielectric constant approximately 1
- Dry Sand: approximately 3-4
- Dry Clay: approximately 5-8
- Water: approximately 80
The dielectric constant describes how strongly a material's molecules respond to an electric field, and liquid water responds far more strongly than dry soil particles (roughly 80 versus 4), so the water content largely determines the dielectric constant of the soil. The higher the dielectric constant, the greater the electrical and microwave contrast between the soil and the air above it, and the more of that radiation is reflected back at the surface instead of escaping, so wet soil emits less microwave energy than dry soil at the same temperature, and that difference is what the radiometer measures.
Turn Thousands of Measurements Into a Map
At this point turfRad has thousands of individual VWC measurements, each tied to a GPS position along your scan lines. The last step is turning those individual points into the continuous moisture map you see in the Portal.
Where measurements are close together, turfRad combines neighboring readings within pixels and interpolates between them. Across the wider gaps between scan lines, a hybrid kriging approach uses the spatial structure and physics about moisture diffusion to calculate the moisture conditions between directly measured locations. Our standard processing resolution is 1m x 1m (3.3ft x 3.3ft) on fairways and 0.3m x 0.3m (1ft x 1ft) on greens.
The result is a continuous and extremely high resolution VWC map that can be used for moisture thresholds, irrigation decisions, dry-spot identification and scan-to-scan comparison.
But Doesn't a Handheld Probe Measure Moisture Directly?
A handheld TDR (time domain reflectometer, it's actually a technology not a brand) can feel very direct: push the rods into the soil, get a number. But under the hood, the instrument is also running an inference pipeline.
A TDR sends a fast electrical pulse along its metal rods and measures the reflected waveform. Electromagnetic signals travel more slowly through materials with a higher dielectric constant, so wetter soil slows the pulse. The instrument uses that travel time to infer the apparent dielectric constant of the small soil volume around the rods.
From there, the final step is familiar: a dielectric mixing model converts dielectric constant into VWC.
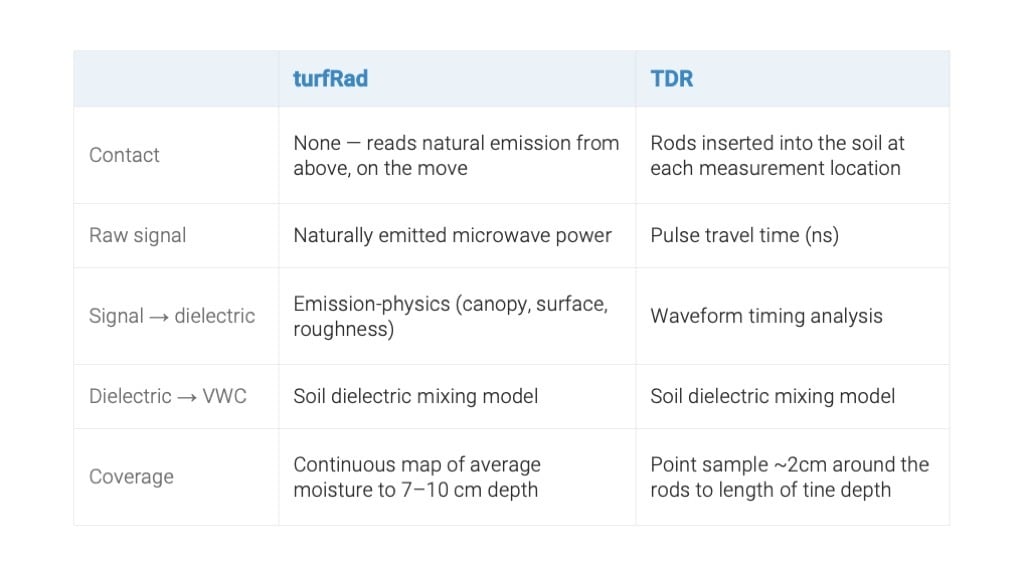
Apart from the non-contract versus contact measurement method, the biggest difference between TDR and turfRad is the measurement frequency and volume. Many traditional dielectric tools operate at an electromagnetic frequency from roughly 100 kHz to 70 MHz. turfRad listens at 1.4 GHz (L-band) - more than 20 times higher in frequency than even the upper end of that range. That higher frequency is one reason the measurement is less sensitive to salinity and electrical-conductivity effects than lower-frequency dielectric measurements.
The other difference is scale. A handheld probe samples a small volume around its rods at one point. turfRad measures a much larger soil volume across the playing surface as you drive. That larger measurement footprint helps smooth out very small-scale heterogeneity and makes it possible to see moisture spatially rather than one point at a time.
Different Measurement Paths, Shared Physics
This is the key point: a TDR does not count water molecules any more directly than turfRad does. Both instruments sense how water changes the dielectric properties of soil, and both use a dielectric mixing relationship for the final conversion to VWC.
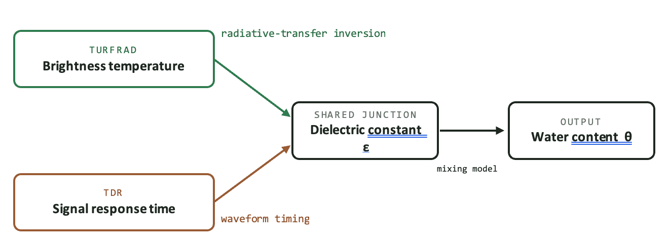
Two instruments, one junction: both pipelines pass through the dielectric constant and share the final mixing-model step.
Why the Difference Matters on a Golf Course
The purpose is not to replace one tool with another. A point probe and turfRad answer different spatial questions.
- A handheld probe gives you a precise point measurement where the rods are inserted.
- turfRad gives you continuous spatial measurements across large playing surfaces.
- The 1.4 GHz L-band frequency reduces sensitivity to salinity and conductivity effects compared with lower-frequency dielectric measurements.
- The larger measurement volume reduces the influence of very small-scale soil heterogeneity.
- The result is a map that shows how moisture changes across the surface, not only at selected sampling points.
That spatial context is where turfRad becomes especially useful. Instead of asking only, "What is the moisture right here?", you can also ask, "How does this entire fairway vary, where are the repeated dry or wet patterns, and which areas are moving away from the conditions I want to maintain?"
Why Calibration Still Matters
The physics behind the measurement is well established, but every golf course has its own combination of soil, turf, organic matter, surface conditions and management practices. That is why turfRad is tuned to local site conditions.
Tuning aligns the turfRad VWC values with the moisture reference you are accustomed to managing to on your course. It allows familiar point measurements and the much broader turfRad spatial dataset to work together rather than treating them as competing measurements or different scales.
Key Takeaway
Both turfRad and TDR-based instruments use the dielectric properties of soil to determine volumetric water content. They simply get there in different ways.
A TDR actively measures signal travel time in a small soil volume at a single location. turfRad passively listens to natural 1.4 GHz microwave emission from the upper root zone and collects thousands of measurements across the course as you drive.
The result is the same agronomic quantity you are familiar with - VWC - but now you can see how it changes spatially across the playing surface, not just at the places you put a probe in the ground.
Further reading
- The power of L-band technology — why 1.4 GHz is the right frequency for root-zone moisture.
- Tuning turfRad: calibration for accurate moisture data — how point probes and turfRad are reconciled in practice.