![turfrad_logo_outlines (1)-1.svg]](https://support.turfrad.com/hubfs/turfrad_logo_outlines%20(1)-1.svg)
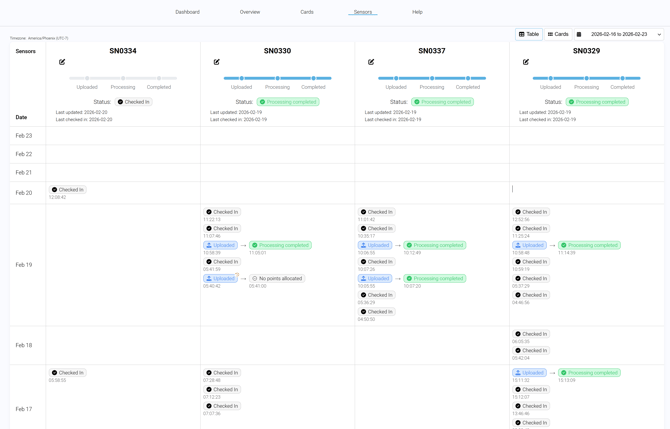
The Sensors tab provides an overview of your hardware status and activity logs.
At the top right, you can choose between table or card view and choose your date range.
1. Sensor Description
Each sensor can be renamed for easier identification. For example, you can name it after the machine where it is mounted, such as "Fairway Unit 1."
Each sensor displays:
- Last activity – the last time the sensor uploaded or synced with our server.
- Last check-in – the last time the sensor connected with the firmware update server and sent its status.
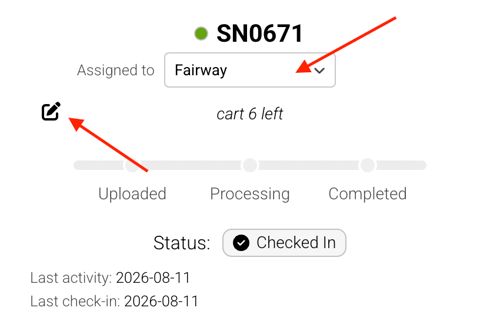
Assign Sensors to Area Types:
By default, all sensors can scan any area of your course. If you have sensors dedicated to specific equipment - for example, a greens mower or roller - you can assign each sensor to one or more area types, such as Greens, Fairways, or Tees. Once assigned, the sensor will only collect data for the selected area types.
This helps prevent unwanted scan lines appearing in areas where equipment is simply being transported, such as driving a roller trailer across fairways or moving a triplex mower between holes.
2. Activity Logs
Every sensor has a log that records key events with timestamps, including:
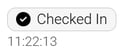
- Checked In = Your sensor is checked in with the firmware update server and its status has been sent. (This is optional and not needed to see your data)
- Uploaded = Your file is uploaded to our server and processing has started.
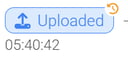
You can hover over the field to get more information about the file size, when it was collected and how long the scan is. (If the Uploaded status has an orange clock on it, that indicates that the uploaded file was captured on a previous day).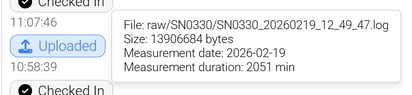
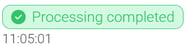
- Processing completed = The uploaded data has been fully processed and the maps have been created. You can now view the maps on the turfRad Portal.
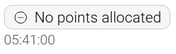
- No points allocated = The scanned area didn’t include any area allocated to a fairway, green, or tee.
3. Scan Route & Drive Statistics
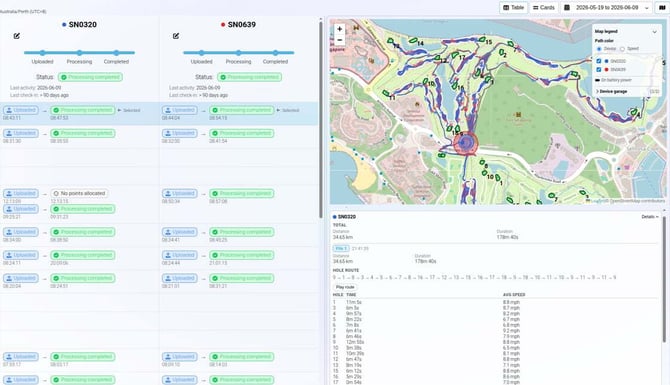
The Sensor page now includes a route visualization for each scan. By default, the most recent scan is displayed, and you can also select previous scan dates to review historical routes.
The route view includes:
- Scan route and garage location
- Average speed, total distance, and scan duration
- Time spent per hole and hole scan sequence
- Drive quality indicators showing where travel speed was too slow, within the recommended range, or too fast
- Speed Mode, which colours the route by travel speed
- Route Playback to replay the scan
- File selection tools for reviewing individual scan files
These tools help verify scan quality and investigate data collection issues.
3. Troubleshooting
Use the logs to confirm if data is flowing correctly. If uploads are missing, check whether Wi-Fi was interrupted or if files are pending. Logs make it easy to spot where issues may be occurring. If you see many "No points allocated" messages with sensor paths around your facility, this is likely a sign of drifting GPS signal. Increasing the size of the upload radius can often resolve this.