On the left side of the Overview tab, you’ll find the Map layers. These give you control over what information is displayed on the map and how it is presented.
1. Moisture: Choose whether to display moisture across fairways, greens, or both together. This helps focus the map on the areas you want to examine most closely.
2. Outlines: You can toggle the visibility of fairway and green outlines, as well as labels.
3. Basemap: Choose the background map style that works best for you. Options include None, Mapbox, Mapbox Light, or Google Maps.

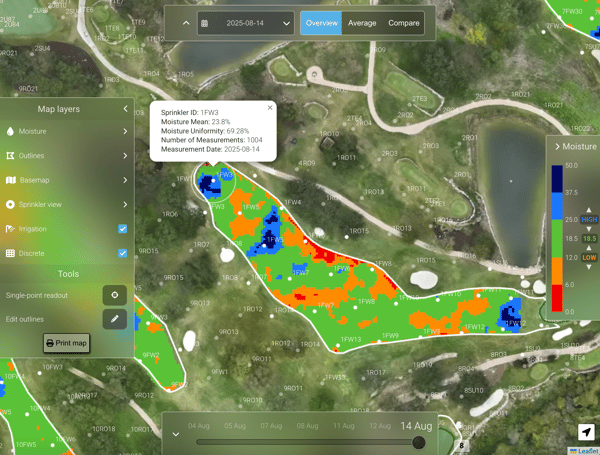
4. Sprinkler View: Enable sprinkler view using the toggle. You can choose between two display modes:
-
Moisture: Shows all sprinkler heads and their moisture distribution. You can filter by condition (e.g. Very Wet, Super Wet) and click on a sprinkler to see detailed information such as average moisture, uniformity, and number of measurements.
-
Uniformity: Highlights sprinkler heads based on how well they meet the uniformity threshold, making it clear which heads are too wet, too dry, or outside the set range
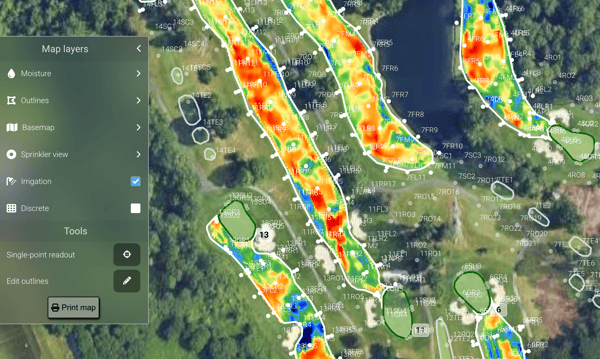
You also have the option to show or hide outlier data - sprinkler radiuses with too few measurements to represent actual conditions (displayed as yellow circles on the map). The yellow number indicates how many outliers are present across the entire course.

Want to read more about Sprinkler View? Visit the following blog post.
Watch the Sprinkler View Demo Video here:
5. Irrigation: By checking this box, all sprinkler heads appear on the map with their sprinkler IDs. This makes it easy to link moisture data back to specific irrigation components.
6. Discrete: When enabled, the map switches from gradient colors to distinct, separated color bands. This sharper contrast often makes it easier to identify clear wet or dry spots and can be more comfortable for some users to interpret.