In the turfRad Portal, you can hover over irrigation heads and fairway outlines to view detailed statistics. These hover pop-ups help you quickly understand moisture performance at different scales:
-
Irrigation head level (within the effective sprinkler radius)
-
Fairway level (across the entire fairway area)
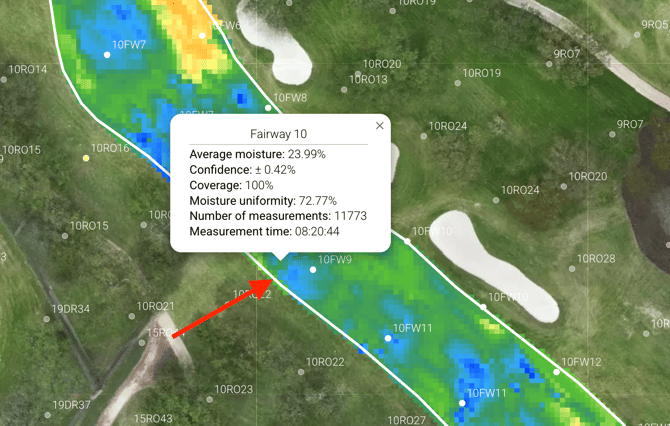
To view the Fairway level statistics, just hover over the white fairway outline:
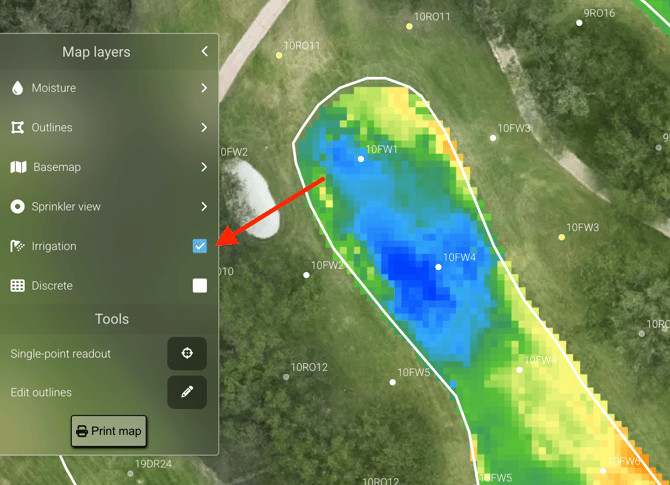
To view irrigation head statistics, you need to toggle Irrigation on.
Then just hover over any sprinkler head to see the detailed statistics for that radius.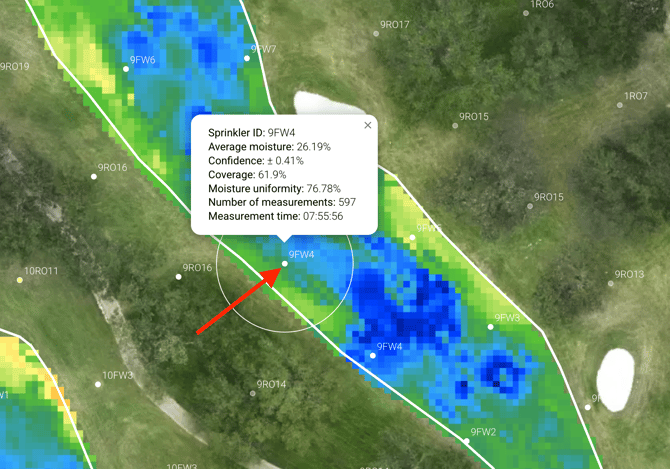
Definition of Statistics
What the hover pop-up shows (definitions).
Average Moisture
The average of all moisture measurements inside the selected area (sprinkler radius or full fairway).
Confidence (95% Confidence Interval)
The 95% confidence interval of the average moisture is based on the underlying statistics.
Scan density (%)
The density of measurements inside the selected area. This parameter indicates how well the selected area (i.e., effective sprinkler radius) is covered with turfRad measurements. You can see, for example, that the scan density is higher if you drive slower and with more overlap. While mower-mounted or wheel-to-wheel driving increases coverage, even ~50% density with an array-mounted cart provides sufficient measurement density for informed irrigation decisions.
Moisture Uniformity (CU)
Coefficient of Uniformity (CU) of moisture inside the selected area.
Number of Measurements
Total number of turfRad measurements taken inside the selected area.
Measurement Time
The average timestamp of the measurements included in the selected area.
These metrics apply to both irrigation heads and fairways, with the main difference being the area included in the calculation.
You can also watch the demo video here: