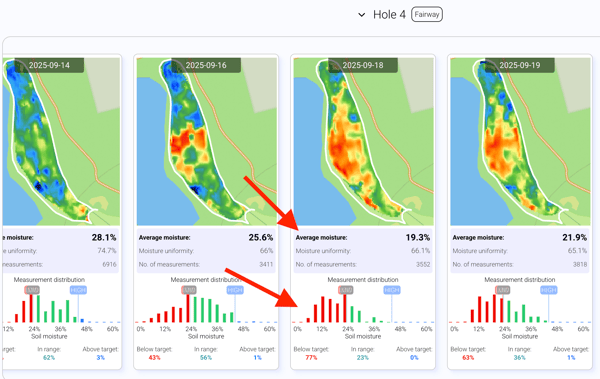
The Card View shows how moisture conditions change over time, hole by hole. It organizes each hole into a card, making it easy to compare and track trends.
1. Date Range Selection
Choose any start and end date. There is no maximum range - you can go back as far as your scan history allows.
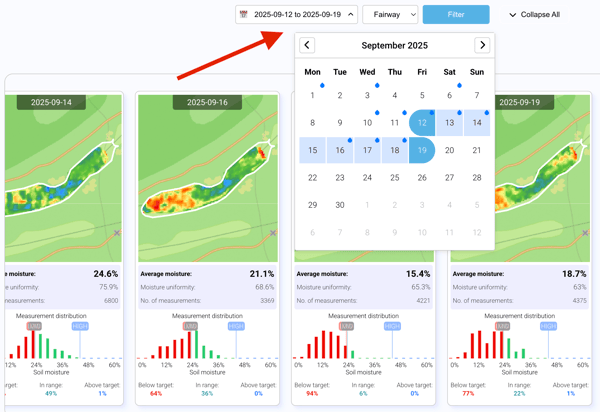
2. Card Contents
Each card includes:
- Average soil moisture for the hole
- Moisture uniformity
- Number of measurements
- Distribution graph (below target, in range, above target)
3. Distribution Graph
The graph shows the percentage of measurements that fall below, within, or above your target range. This gives a quick snapshot of whether the hole is too dry, too wet, or on target.
4. Play Mode
Cards include a playback feature that cycles through scan days like a video. This makes it easy to spot patterns over time without clicking through individual dates.
5. Practical Uses
Card View is useful for: Tracking irrigation performance, checking conditions before tournaments, confirming the impact of irrigation or system adjustments, and deciding when to resume irrigation after rain.
Additional Information
Read more real-world examples of how superintendents put Card View to use here.